Clear understanding
drives extraordinary results
From descriptive reporting
to prescriptive analytics
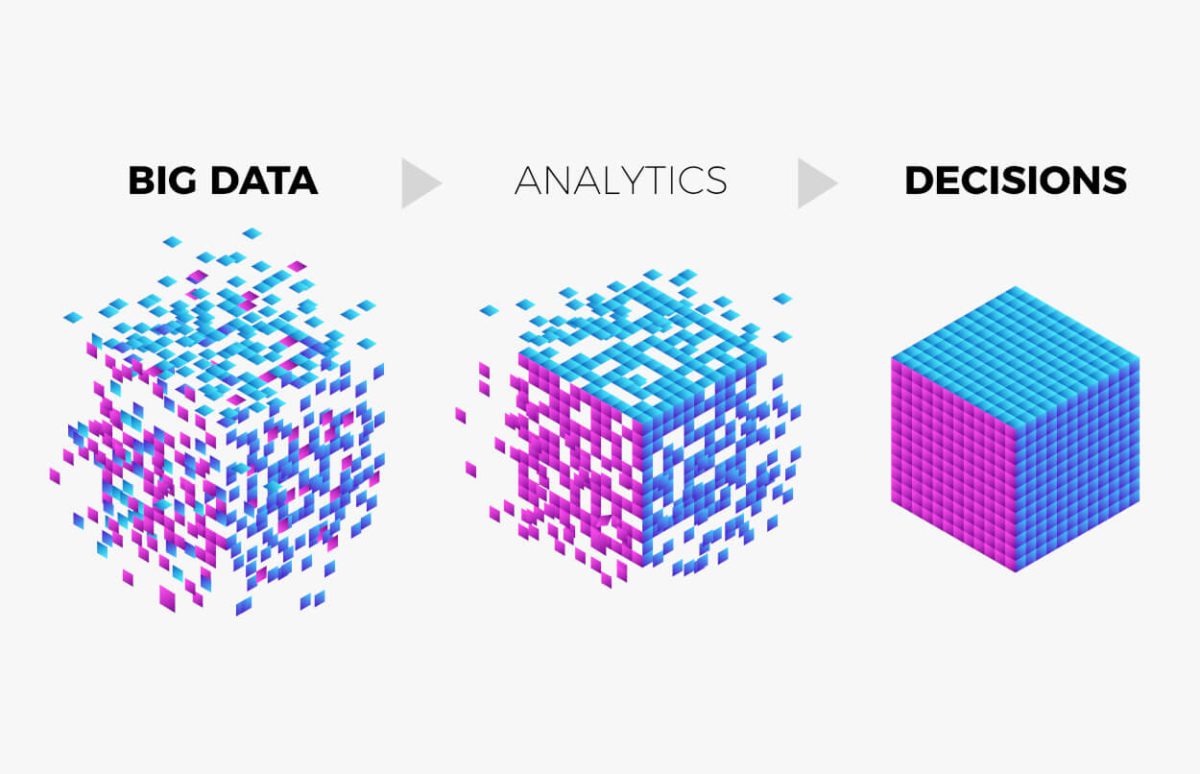
Data analytics pulls together all of the relevant data that has been collected and converts it into a form that communicates valuable insights. This process provides actionable information that managers can use to monitor their business more closely and make timely decisions to improve performance. Without analytics, an organization is not making the best use of the data it has collected.


While this is a simple example, the process becomes more difficult when large amounts of data have been collected. To be insightful, this data must be analyzed and compared in the context of factors like region, department, time period, etc. Even more importantly, these insights need to be communicated to decision-makers in a way that is simple to understand at a glance. The company in our example would have eventually recognized the problem, but having this information provided regularly would allow them to address it as soon as possible.
Drive growth with
Key Performance Indicators
Businesses, at a basic level, want to increase profits and decrease costs. As such, common KPIs include sales growth, profit over a period of time, expenses (such as payroll and cost of goods sold), customer retention, and fulfilment timelines. By focusing on these KPIs and having them presented in a form that is easy to read and understand, businesses can quickly catch problems and make changes.
But how does a business extract this helpful information from a mountain of data and get it into a usable form? There are different types of software that help companies accomplish this.
KPIs that keep
your company improving
Profitability
Customer Centricity
Efficiency
And much more


POWER BI IN A DAY FOR FINANCE AND CONTROLLING
We guide you to uplevel your financial reporting with Power BI and save up to 90% of your Excel Workload with skills you already have
From spreadsheets to modern analytics
Software such as Alteryx can be used to extract, transform, and load (ETL) data. The ETL process cleans data (for example, eliminating duplicate information or incomplete customer contact details) and organizes it into a form that is easier to analyze.
Visualization software such as Power BI and Tableau can be used to analyze this clean data and present it in a way that tells a story visually. This can help managers see exactly where the business is falling short, where more attention is needed, and identify waste. KPIs are updated regularly so that a decision-maker can see the current status of crucial metrics and track them more efficiently.
The use of a visualization tool can create a dashboard that communicates the KPIs in real-time. With this, a manager can tell at a glance that a certain location is more profitable, that a particular product is not selling well, or that orders are not being fulfilled in the expected time. By tracking this, problems are dealt with as soon as possible.
Conclusion
HOW WE CAN HELP YOU FURTHER
Related Services
Data Analysis
Dashboard Design
Data Governance
Data Architecture
Calculation Engines for Finance

